
A tight factory, seen at a glance.
Every number comes from records your team already keeps in V5 — weights, checks, downtime and costs — so nobody re-keys a spreadsheet and every figure links back to its evidence.
7-day free trial, no card required. OEE · Yield · Right first time · SPC · Downtime · Cost
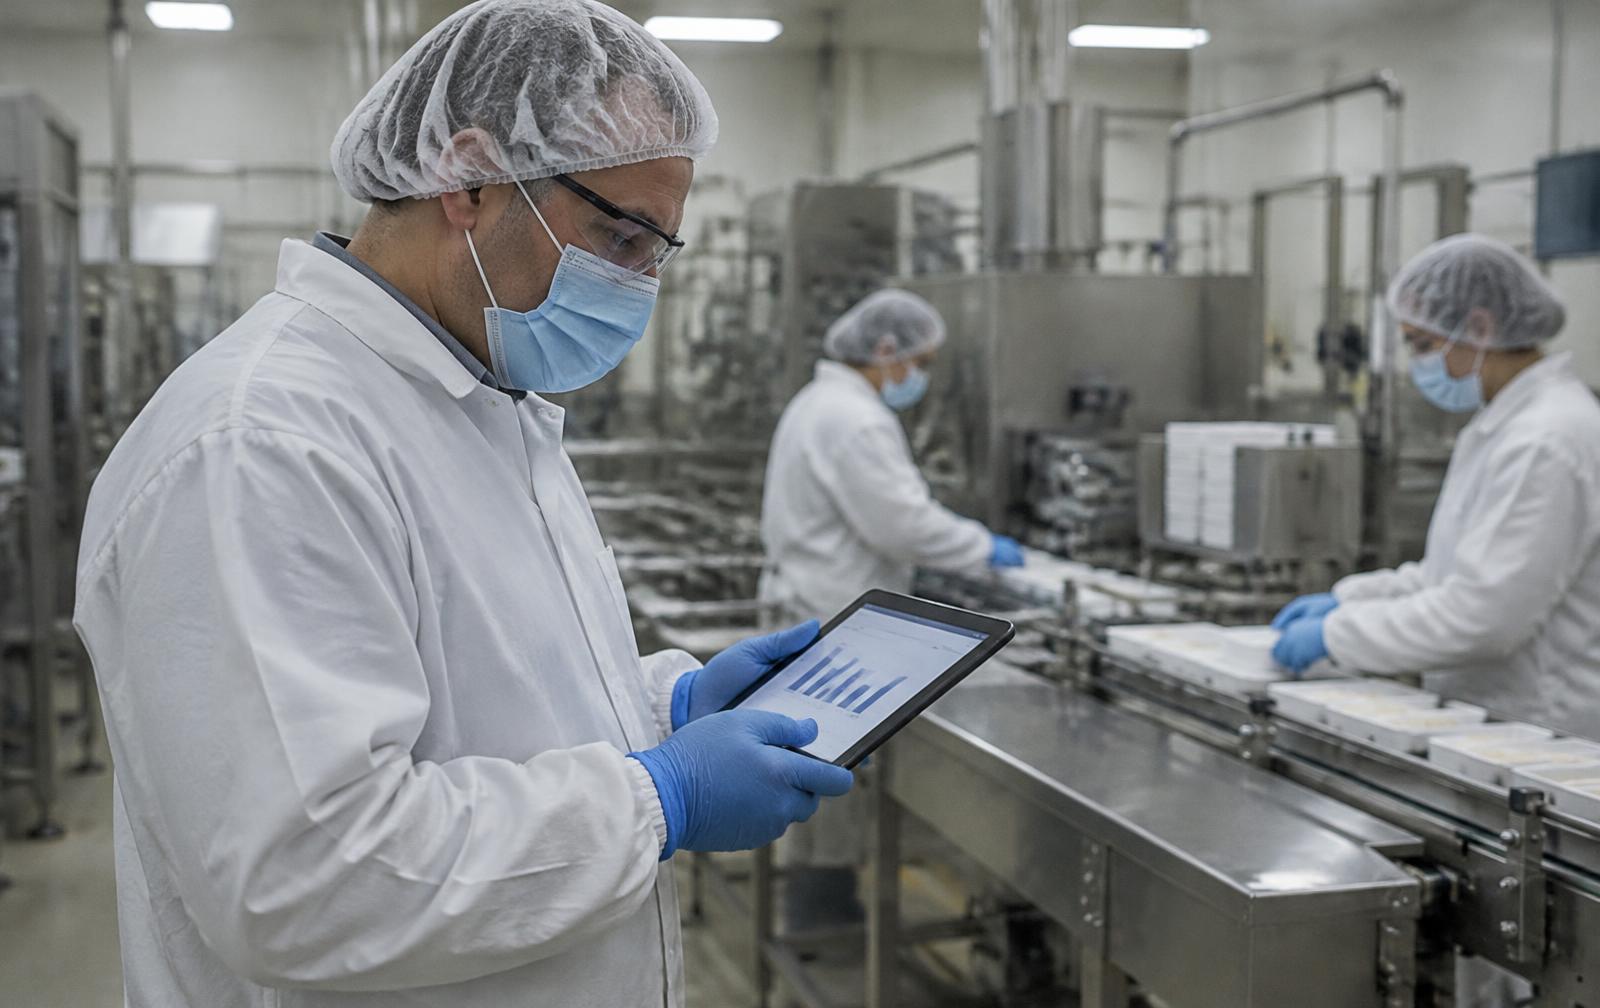
One clear view at a time.
Explore the floor, equipment, quality, losses and yield.
A tight factory, in one view.
Production, yield, right-first-time and cost together — a clear starting point for the shift.
Example figures drawn to show the views. Which dashboards you get depends on your plan and setup.
Dashboards your team will actually open.
More than 80 ready-made KPIs ship with V5, and you can build your own.
- Availability93%
- Performance94%
- Quality99%
- 0.0%
- SQDC
- PM on time0%Calibrations current0%
Need one we haven't thought of? Build it.
The KPI builder lets your team create their own tiles — pick a source like work orders or lab results, choose what to count or average, set filters and a time window. No code, no waiting on us.
- 80+ ready-made KPIs cover the common measures out of the box
- Custom tiles sit beside built-in ones on any dashboard
- Every number drills back into the records behind it
- SourceWork orders
- MeasureAverage · actual duration
- FilterLine = Line 2 · last 30 days
Look ahead. Keep people in control.
An animated exploration of the yield and demand forecasting on V5’s roadmap — not available today.
Start with the evidence.
The forecasting concept starts with recorded batch history, not a guess about your factory.
More of the product
Start with one area. Add the rest when you are ready.
 Warehouse & TraceabilityExplore
  Production & PlanningExplore
  Quality & LaboratoryExplore
  Documents & TrainingExplore
 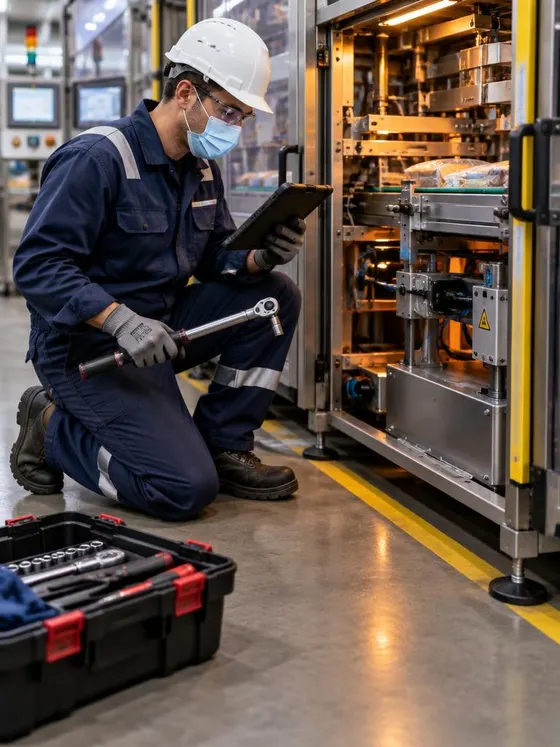 Equipment & PerformanceExplore
  Orders & IntegrationsExplore
See it on your own floor.
Start a free trial or talk it through with us. No card needed.