
A number your team can check, then act on.
Reports draw on records captured in V5, so a KPI can be traced to what it counts and turned into an agreed action.
7-day free trial, no card required. Standard reports are in every plan; regulated reports and the report-building assistant are in Professional and Enterprise; cross-site dashboards, custom reports and scheduled exports are in Enterprise.

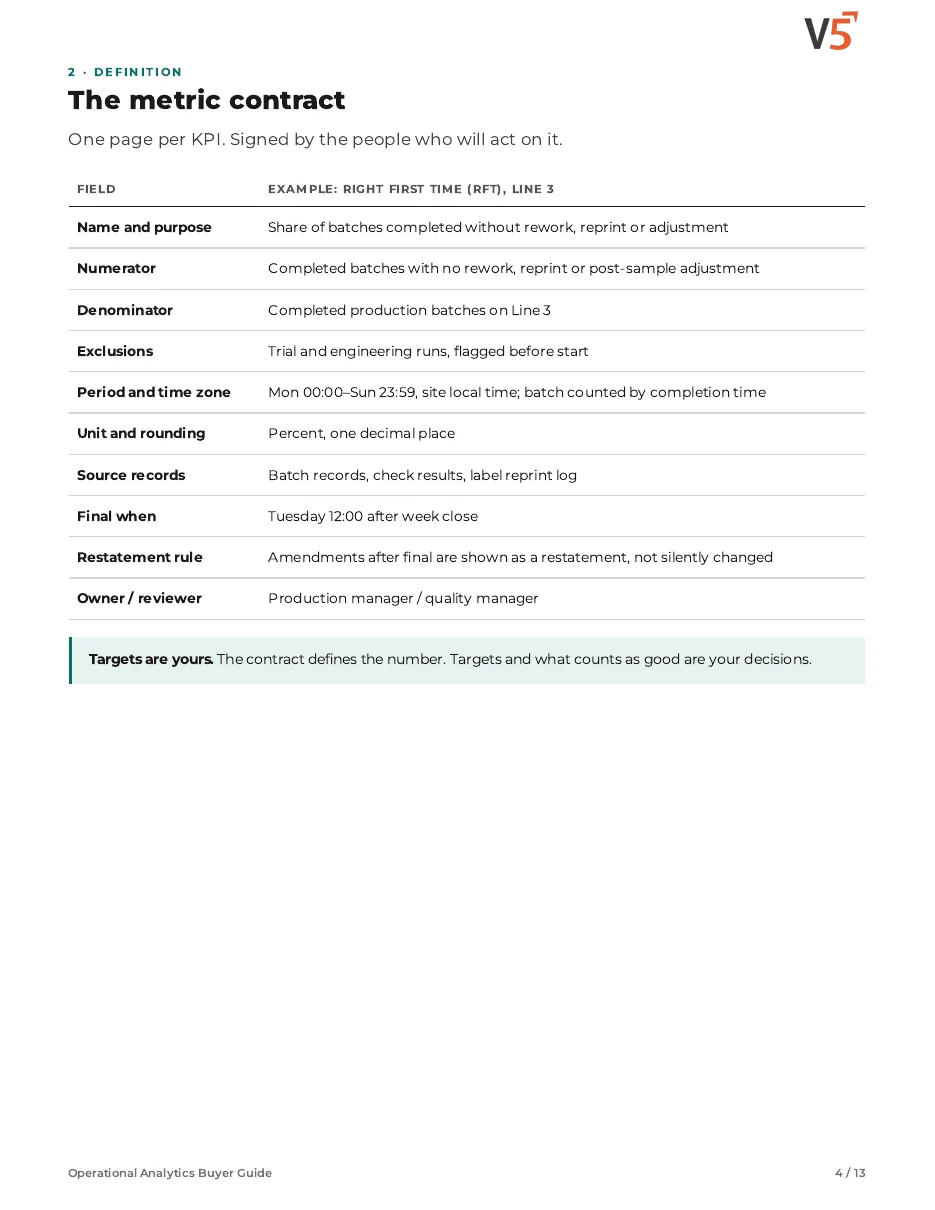
Defined before it's shown.
Write what each KPI counts, its period and what's excluded.
Traced to records.
Supported reports open to the jobs, checks and holds they count.
Ends in an action.
Each review leaves an owner, a due date and a check.
Follow one number back to its records
Line 3's right-first-time figure dips. Four stages from the tile to an agreed action.
A number, its records, one action
Try it: open the number, then record what the team agreed.
Example data. 31 ÷ 34 = 0.912 → 91.2 %. Which reports open to their records depends on the report; ask to see the ones you'll use.
See one number traced step by step
Tap a step below to see what happens.Choose a step below to see what happens.
Step 1 of 4
- Right first time91 % · last week 96 %
- Jobs completed34
- Jobs with rework or hold3
- Downtime3 h 10 min
Every tile states what it counts.
A number changes
- Pulse tiles show quality, output, downtime and yield by line.
- The tile shows what it counts and the period.
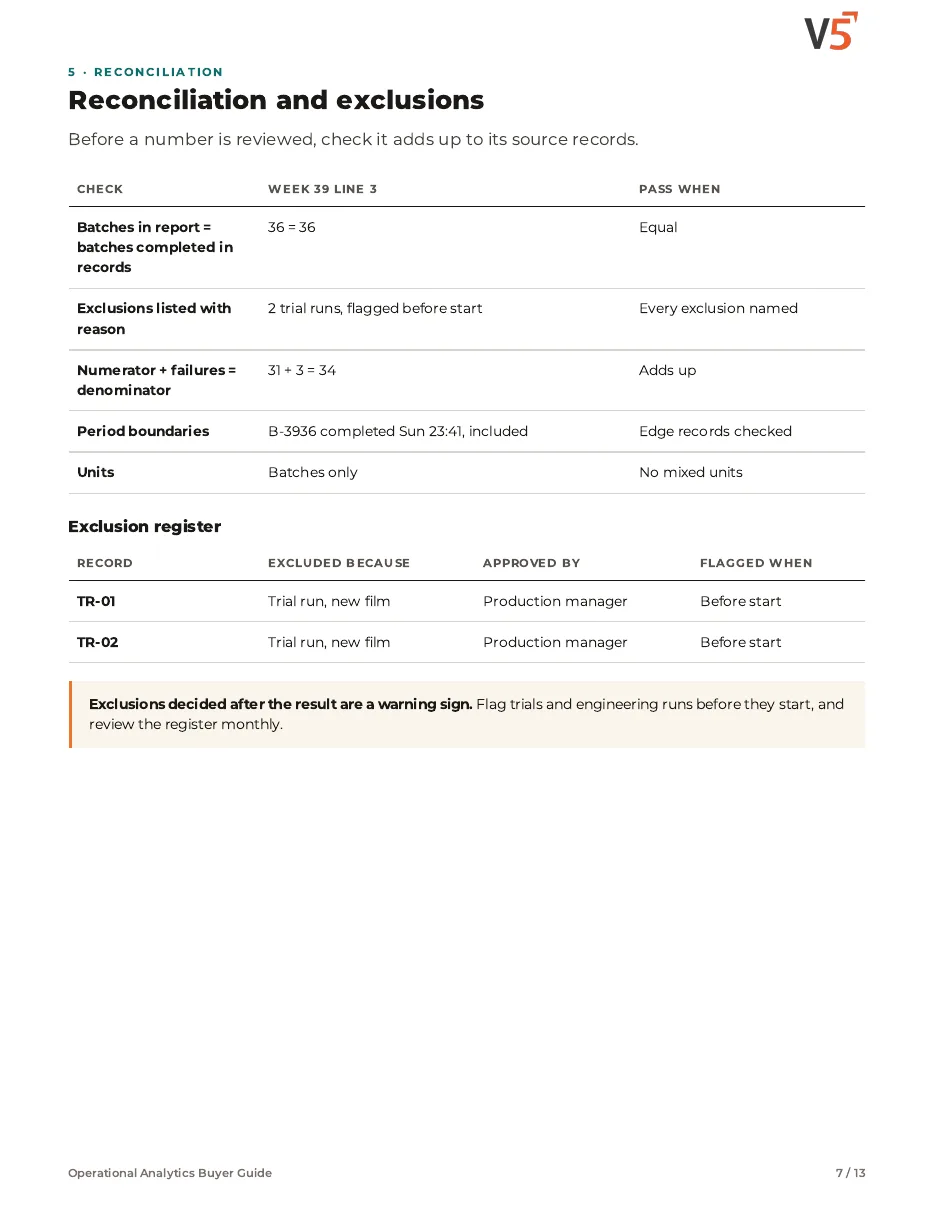
A KPI is only as good as the records behind it.
More on the tile: full record and set-up
Also on this record
- Yield vs standard
- −1.2 %
A drop is a prompt to look, not a conclusion.
- Compliance pulse
- Overdue training, expiring documents, open deviations and late CAPAs appear in one widget.
Operational Analytics Buyer Guide
For operations, quality and finance teams who need KPIs everyone defines the same way and can check against the records.
- 1Write the denominator down.
- 2Reconcile before you chart.
- 3Every number gets an owner.
We ask for your name and email so we can handle this request. The PDF downloads in your browser. Privacy policy

Where the numbers come from
Reports read the records these pages create.
Reports
See, open, agree, share.
Standard reports and pulse tiles · Daily brief · Regulated reports
Explore analytics
Reports
See, open, agree, share.
Standard reports and pulse tiles · Daily brief · Regulated reports
- Standard reports and pulse tilesBuilt from records.
- Daily briefWhat changed.
- Regulated reportsProfessional and EnterpriseQuality and compliance.
- Report Builder assistantProfessional and EnterpriseDescribe, then check.
- InsightsEnterpriseCross-site dashboards, custom reports, scheduled exports.
Supported reports open to their records. People agree definitions and decide actions.
AI that sees it coming
It predicts and flags. Fixed rules decide. People sign.
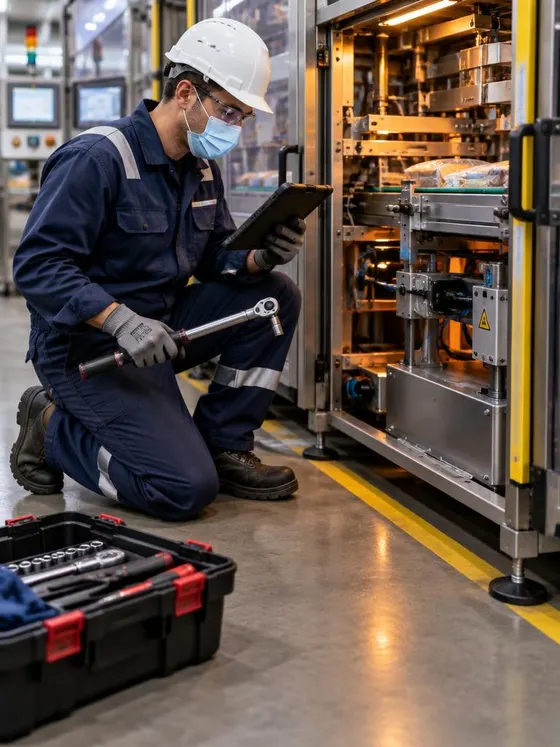
Plan maintenance ahead.
Due dates and usage show what needs attention next, before it stops a line.
Straight answers.
What buyers ask us first about Equipment & Performance.
Can V5 block an out-of-calibration scale?
The kiosk can block devices that are out of calibration, depending on how you configure it.
Does it cover planned maintenance?
Yes. Maintenance includes planned work, downtime reasons and requisitions, with OEE built from what is recorded. Maintenance and OEE are on Professional and Enterprise.
Do our machines need to connect?
No. You can record downtime and checks by hand. Device connections are optional and each one is confirmed in setup.
More of the product
Start with one area. Add the rest when you are ready.
 Warehouse & TraceabilityExplore
  Production & PlanningExplore
  Quality & LaboratoryExplore
  Documents & TrainingExplore
  This feature's areaEquipment & PerformanceExplore
  Orders & IntegrationsExplore
See your own KPIs built from your records.
Start a free trial or talk it through with us. No card needed.